Dashboards
RT's dashboard feature provides a convenient way to create your own pages focused on displaying the tickets, charts, and other components you need for any task.
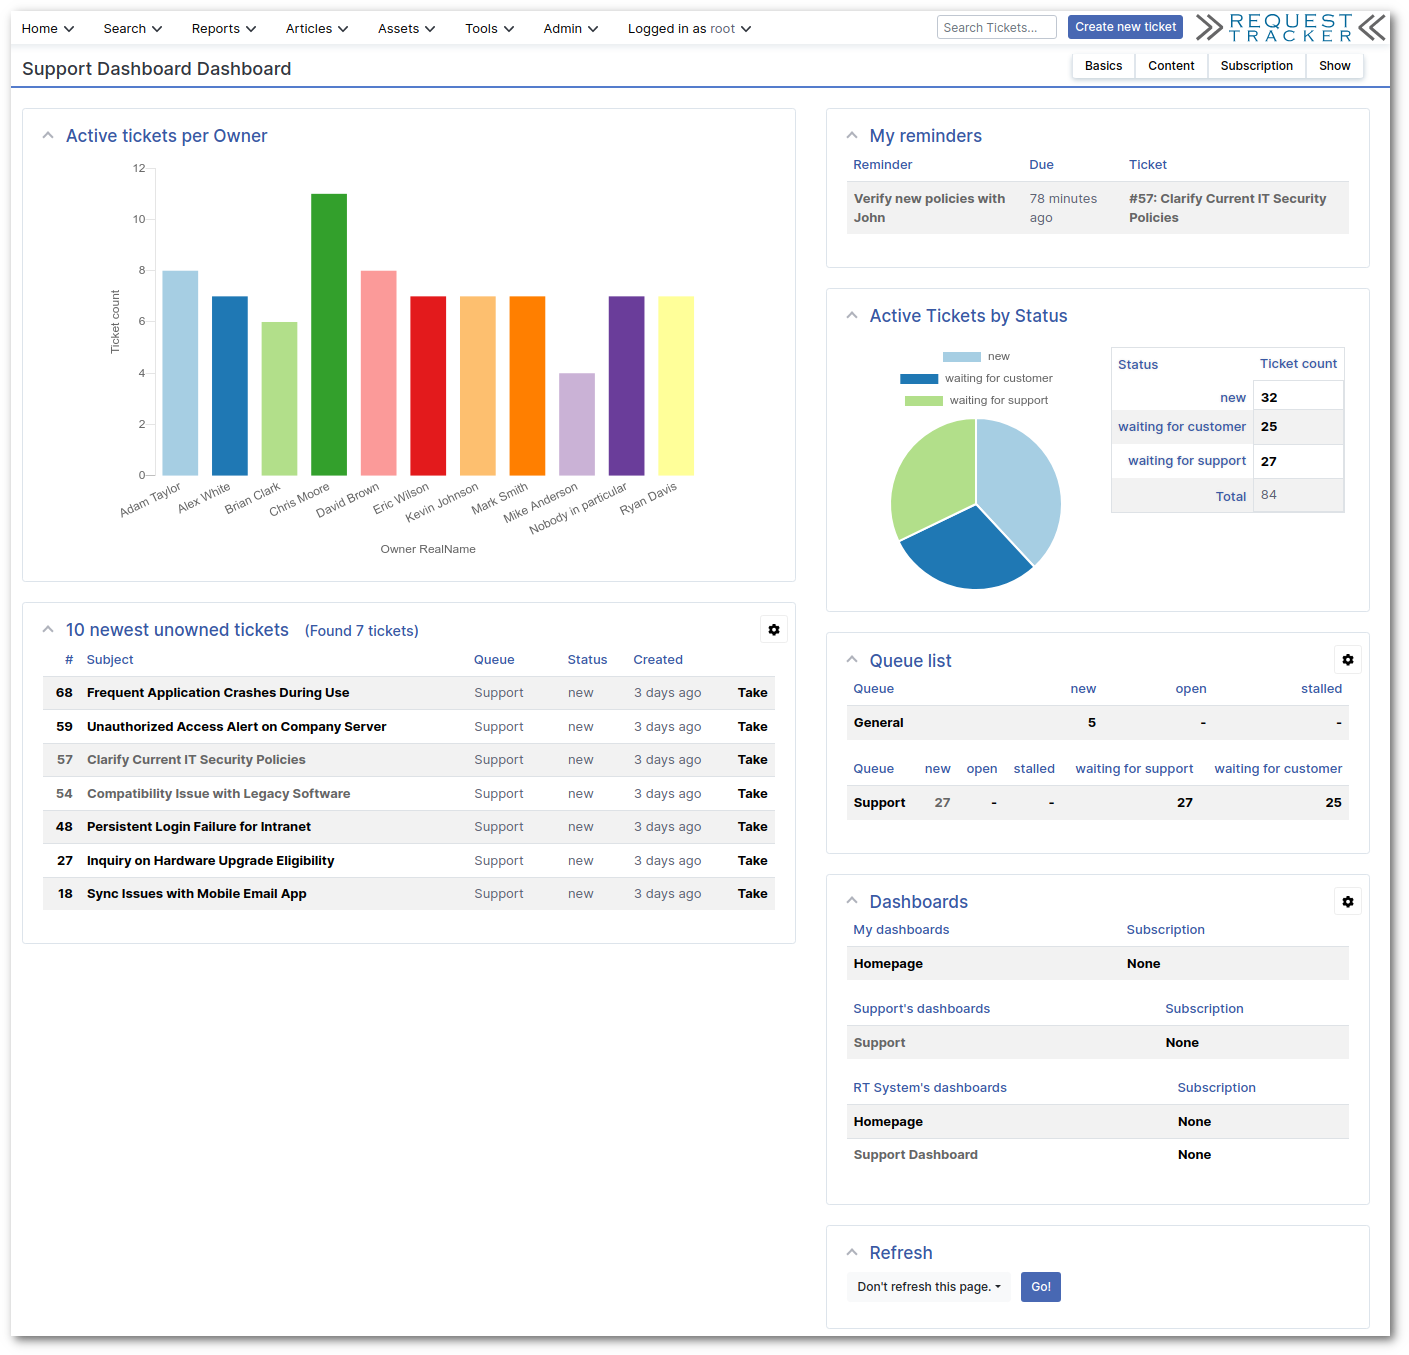
Dashboards are available right from the Reports menu, can be set up individually or shared, and can even be sent out via email on a schedule. Dashboards are built using saved searches, charts and other custom components, allowing you to organize and display important ticket information in a multiple-row, multiple-column customizable layout.
Homepage
RT's homepage is a dashboard that has been set as your current homepage. By default, all users see the system-level dashboard set by the RT administrator. If you have the "ModifySelf" right, you can easily change your homepage by clicking on the gear icon. You'll see a page showing you all dashboards you currently have access to. Click "View Dashboard" to see what it contains. If you have rights, you can use "Edit Dashboard" to update a dashboard. Just click the "Set as Homepage" button to change your homepage to a different dashboard.
To create your own custom dashboards and use one as your homepage, you can click the "New Dashboard" option in the submenu on the customize page. Details on how to set up your new dashboard are provided below.
Creating and Configuring Dashboards
Creating a Dashboard with existing Widgets
To describe the process of creating a dashboard, we'll start with a simple example by creating a dashboard with widgets that already exist in the system.
To create a new dashboard, select Reports > Actions > New Dashboard. You'll see a page where you can enter the name of your new dashboard, a description, and set its privacy level.
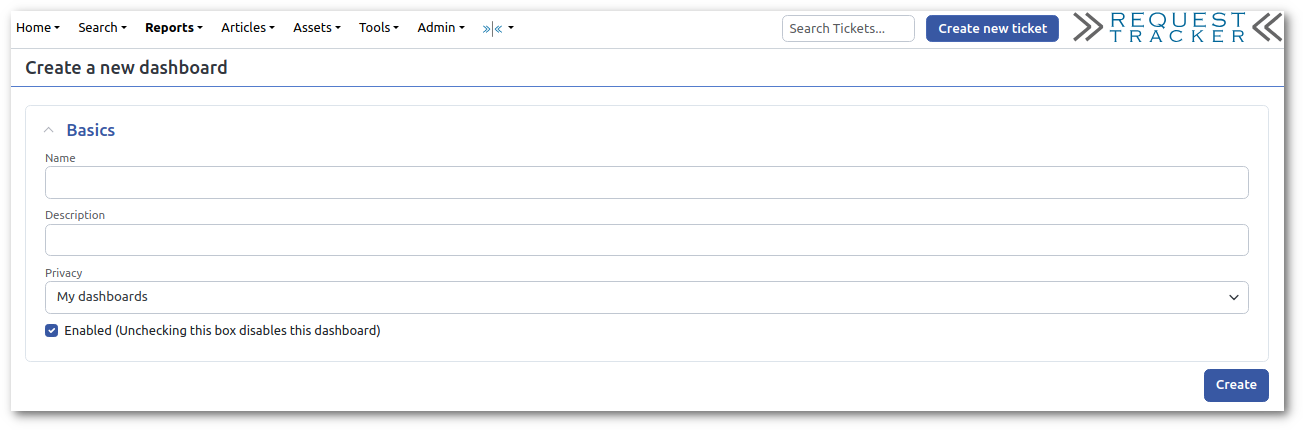
The privacy level determines who can see the dashboard. It will be set to "My Dashboards" by default. If you have rights to create dashboards for specific groups, they will be listed here as well as "Group name's Dashboards". If you have rights to add system-level dashboards, you will see "RT System's dashboards" as an option. You can see further details on privacy levels in "Dashboard Rights"
Click Create and you'll be taken to the dashboard configuration page.
Page Layout
After creating a new dashboard, click the "Content" submenu to add widgets to your dashboard. New dashboards are created with one empty row to get you started. To customize this row, click on the pencil icon. The popup allows you to set a Title, which is optional, and to specify the number of columns for this row.
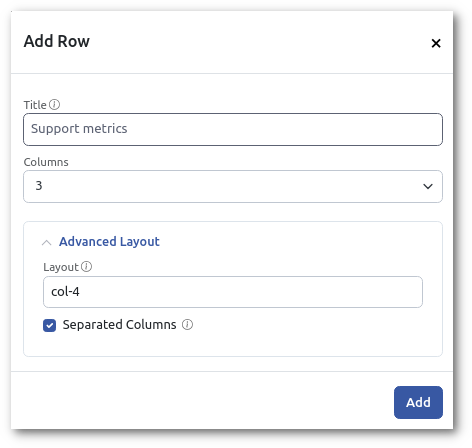
In the "Advanced Layout" section, you can set the width of each column. The page layout is built with the Bootstrap grid system. The width of the columns must add up to 12. If you want to create a 3-column layout, RT will default to 3 even columns and set the Layout to "col-md-4". But you can set the width of each column to be different. For example, if you want a layout with 2 smaller sidebars and a larger main column in the middle, you might set the layout to "col-md-3,col-md-6,col-md-3".
Dashboards can have multiple rows, each with a different number of columns. To add more rows, click the plus icon on the right.
Creating a Personal Dashboard
Now, to show some additional dashboard features, we'll set up a dashboard and notifications to track outstanding invoice tickets. Let's assume you work in the accounting department and want to manage invoices on tickets.
As mentioned before, saved searches and charts are the principal building blocks of dashboards, so to set up a new custom dashboard you might first need to create and save a search that displays the ticket data you want. For our example, we want to view new and open invoice tickets in our Accounts Receivable queue. On the ticket search page, we create a new search with this query:
Queue = 'Accounts Receivable'
AND (
Status = 'new'
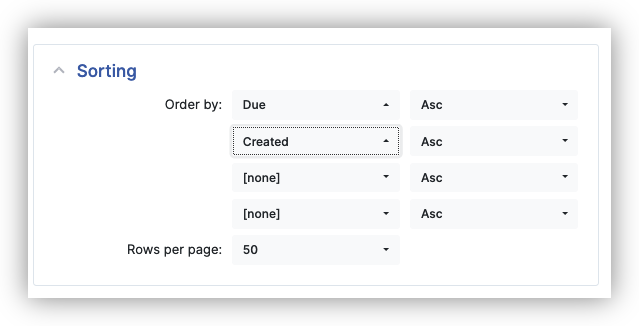
OR Status = 'open' )We also want to modify the sort order of the search to use Due rather than the default id. In the Sorting section, we select Due for the initial sort, then add Created as the second sort value. Finally, we set Rows per page to Unlimited so we don't miss any invoices.
Once you have those set, you can click "Add these terms and Search" or "Update format and Search" to see the results. If it's still not quite right, you can click "Edit Search" in the submenu and continue to refine things.
When you're finished tweaking the search, return to Query Builder page again so you can save it. Under the "Saved Searches" box, type "Outstanding Invoices" in the Description box. For now, leave Privacy set to "My saved searches" and click Save. You now have a saved search you can use for your dashboard.
Create a new dashboard as described above. Type "Outstanding Invoices" for the name and leave the privacy set to "My Dashboards". Click Create and the new dashboard is created.
Now we want to populate the new dashboard with the saved search we created. Click Content in the submenu to go to the Page Layout and content selection page. You can set the title to "Outstanding Invoices" and set the number of columns to 1. Find your saved "Outstanding Invoices" search and drag it from the "Available Widgets" section to the place where you want it in the Page Layout. Click Save Changes when you're ready.
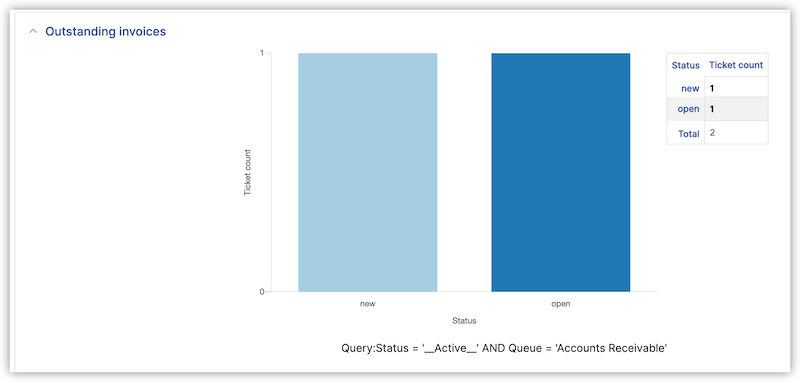
Click Show in the submenu and you'll see your new dashboard.
Go to Reports > Actions > "All Dashboards" and you'll see your new dashboard is in the list.
On dashboard pages, you can click on the title of any section and go to the search results page for the saved search. This makes it easy to find the saved search and update it, or modify it ad-hoc for a one-off search based on the saved dashboard search.
In this example we're only adding one search, but you can add multiple searches to each individual dashboard to track different types of interrelated information and see it at a glance. For instance, two queries, "outstanding invoices" and "overdue invoices," could form a dashboard called "all outstanding invoices." Software engineers using RT might combine three queries, "bug fixes," "feature requests," and "documentation," into a dashboard called "our new release."
Charts in Dashboards
You can also display saved charts in dashboards, creating a powerful visual of ticket data in a convenient page. To add a chart, start with a search, refine your query, then click Chart in the submenu in the Query Builder or Search Results page. Configure your chart as described in charts, select a Privacy setting, name it "Outstanding Invoices", and click Save.
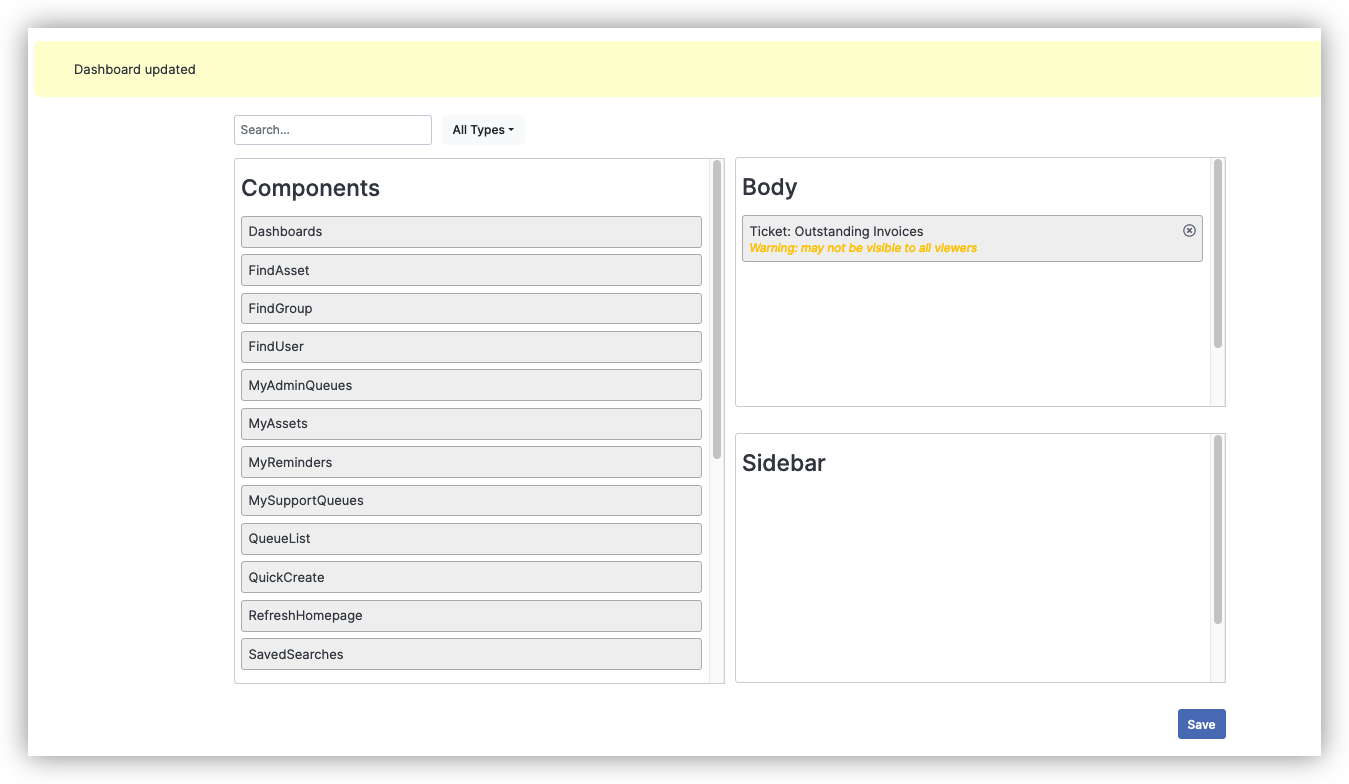
Return to the dashboard, click Content, and you'll see a new "TicketChart: Outstanding Invoices" option in the Available column. Select it and click the arrow to add it to the dashboard. Now when you load the dashboard, the chart will be rendered right below the saved search.
Components
RT also provides special widgets called components that you can add to your dashboards. These pre-defined components provide common searches like "My Tickets" or custom functionality like the "QuickCreate" widget. You'll see these in the Components section of "Available Widgets" when you create and modify dashboards.
Reports Menu Entries
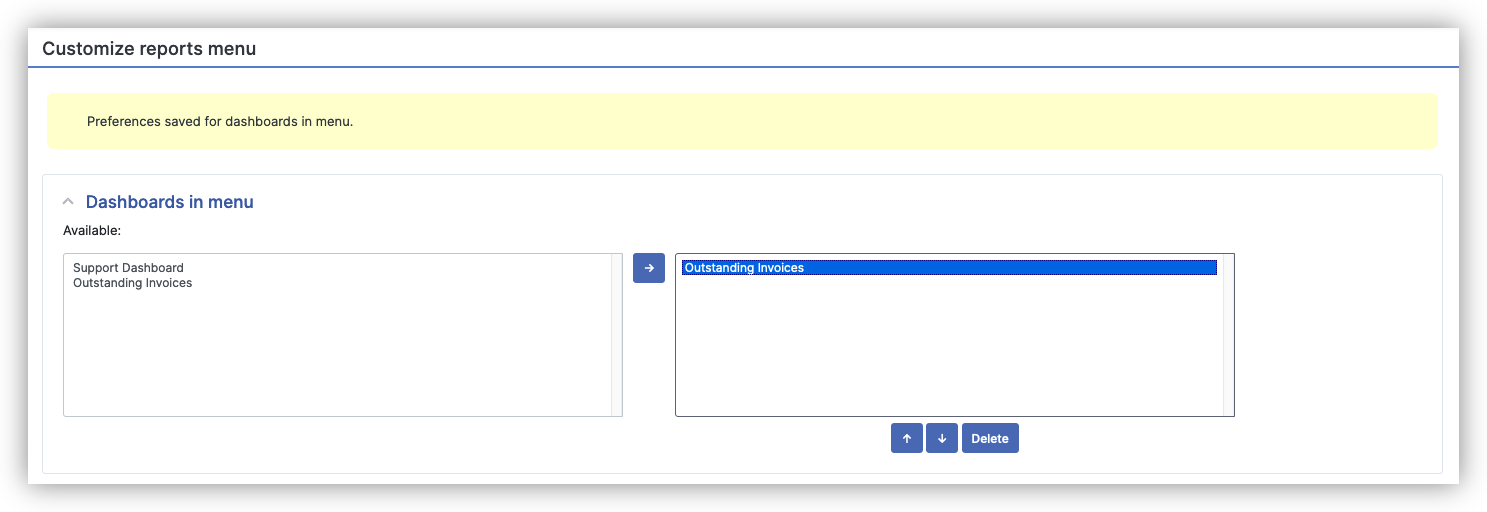
You can add your Dashboards and Reports to the Reports menu. To modify the Reports menu, select Reports > Actions > "Update This Menu" or "Logged in as" > Settings > "Modify Reports menu". The customize page allows you to drag and drop the dashboards and reports you want to appear under your Reports menu.
As an RT administrator, you can populate the dashboard menu for other users on the system. Find a user using Search > Users or Admin > Users > Select, then click on the user to open the modify user page. In the submenu, you'll see a Settings > "Reports Menu" option, and it works the same as the personal setting.
Group Dashboards
You're enjoying your new dashboard but it's time for some vacation and it would be nice for someone else in the accounting department to be able to use your dashboard while you're gone. RT makes this easy with group-level dashboards.
As we've seen, the dashboard is based on a saved search, so you first need to make that available. Go to the ticket search page (Query Builder), find your saved search in the "Load saved search" dropdown, and click Load. If you are in a group, like the Accounting group, there will be an option in the Privacy dropdown called "Accounting's saved searches". Select that option and click Update to make the search available to the Accounting group.
To update your dashboard, select it from the menu to view it, then click Basics in the submenu. Like on Query Builder page, you'll see your group listed in the Privacy dropdown. Assuming your group is Accounting, select "Accounting's Dashboards" and click Save Changes.
Click on Content and you'll see a message that a query has been deleted and removed from the dashboard. This is because RT has detected that you have moved the saved search from personal to group privacy. Select "Outstanding Invoices" from the Available column and click the arrow to add the group-based search to the dashboard.
All members of the Accounting group should now have access to your dashboard. They can now add it to their Reports menu if they want. If other members can't see it, make sure you have granted sufficient rights to the group (see "Dashboard Rights").
System-wide Dashboards
You can also set up dashboards for all users on your RT system. Follow the steps above for group dashboards, but for Privacy, select "RT System" for the saved search and dashboard.
If you want to make sure everyone has the dashboard in their Reports menu, you can set this globally as well if you are the RT administrator. The Admin > Global > "Modify Reports menu" opens a page similar to the personal dashboard menu page, but it puts the selected dashboards and reports into everyone's Reports menu.
Dashboard Subscriptions
RT's dashboard subscription feature allows you to email dashboards based on a schedule you set. These scheduled dashboards can be particularly useful for time-based reports that you want to see on a regular basis.
To set up a subscription, go to the dashboard you'd like to have emailed and click on Subscription in the submenu. This will take you to the subscription page.
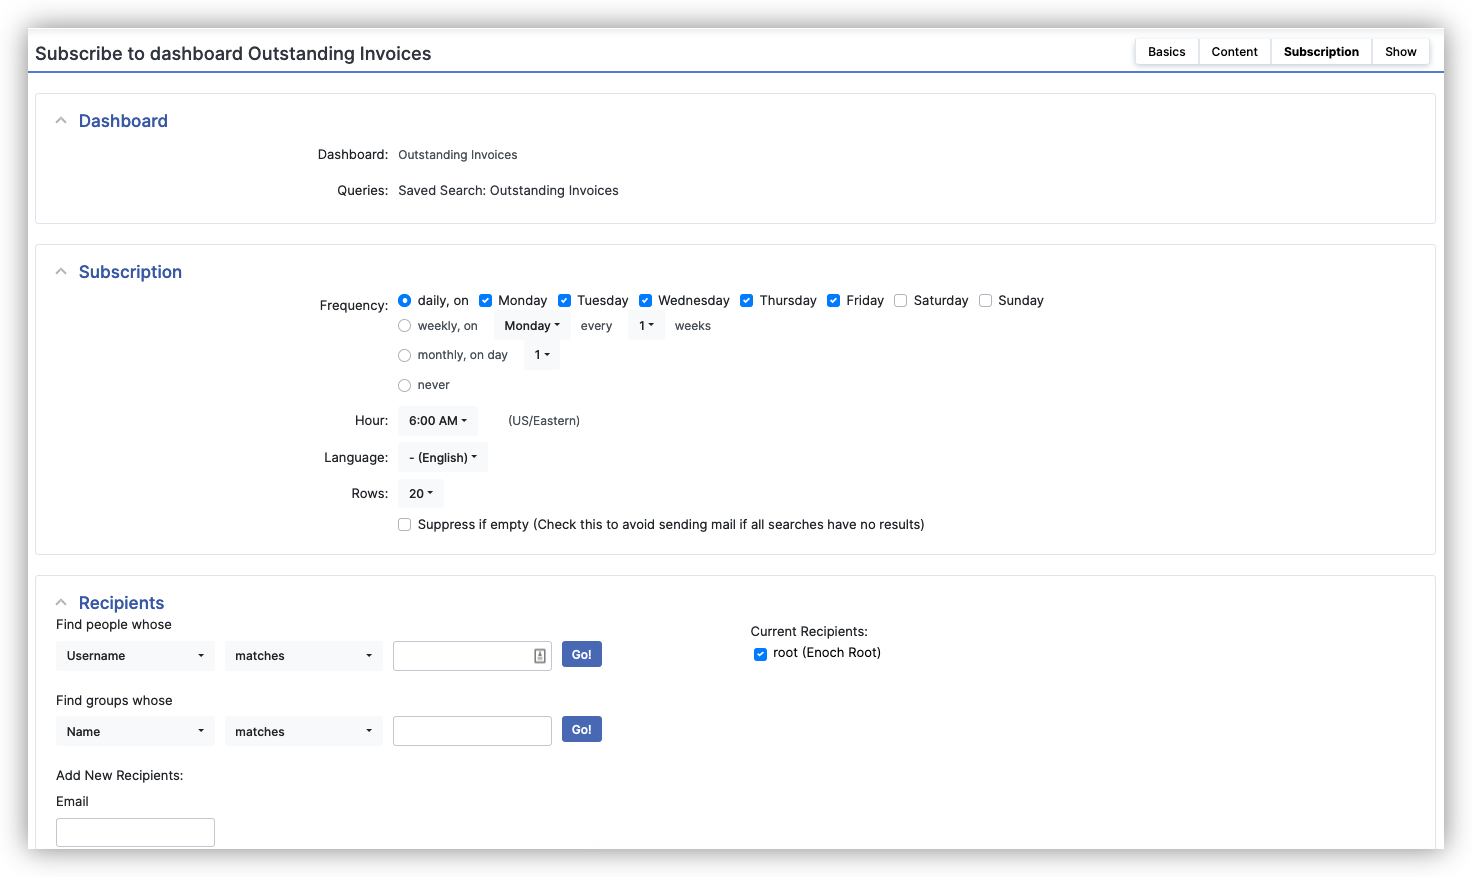
Select the frequency and timing you want and enter the email address the dashboard should go to. You can leave it blank to send mail to your RT email address. Click Subscribe and that's it, you'll start getting dashboards via email.
This feature requires the rt-email-dashboards script to be scheduled in cron as described in RT's README file.
Dashboard Rights
RT has a comprehensive rights system for dashboards that allows you to control who can view and manage dashboards at various levels. As with any RT rights, you can grant these to individual users (usually difficult to maintain over time), to system roles like Privileged, or to groups you define.
Since dashboards rely on saved searches, you need to grant "Allow loading of saved searches" (LoadSavedSearch) for users to see the searches. You may also want to grant related saved search rights such as "View personal saved searches" (SeeOwnSavedSearch) and "Create, update and delete personal saved searches" (AdminOwnSavedSearch).
For dashboards, RT provides a consistent set of rights at three different levels:
System level - affect dashboards visible to all users:
SeeDashboard - "View system dashboards"
AdminDashboard - "Create, update, and delete system dashboards"
Group level - affect dashboards shared within groups:
SeeGroupDashboard - "View group dashboards"
AdminGroupDashboard - "Create, update, and delete group dashboards"
Personal level - affect a user's own dashboards:
SeeOwnDashboard - "View personal dashboards"
AdminOwnDashboard - "Create, update and delete personal dashboards"
General dashboard rights:
SubscribeDashboard - "Subscribe to dashboards"
If you just want to allow users to create dashboards so they can customize their homepage, grant "ModifySelf", "SeeOwnDashboard", and "AdminOwnDashboard". All users can select the current default System dashboard and set it as their homepage.
SuperUsers have access to all dashboards in the system. However, being a SuperUser will not automatically add all groups to your Privacy menus when creating a dashboard. If you need to create a new dashboard for a group, add yourself to the group. When you are done you can then remove yourself if you no longer need to be in the group.
← Back to index